
Dissecting the Market Volatility
By TRG Advisors on January 24, 2022
Economic Uncertainty Leads to High Market Volatility
There’s a significant amount of economic uncertainty right now that is fueling market volatility — specifically around higher interest rates, the velocity of the move higher, significant headline inflation and the Fed’s path toward normalizing monetary policy.
Chart 1: U.S. 10-year Treasury Yield vs. CPI (less food and energy)1
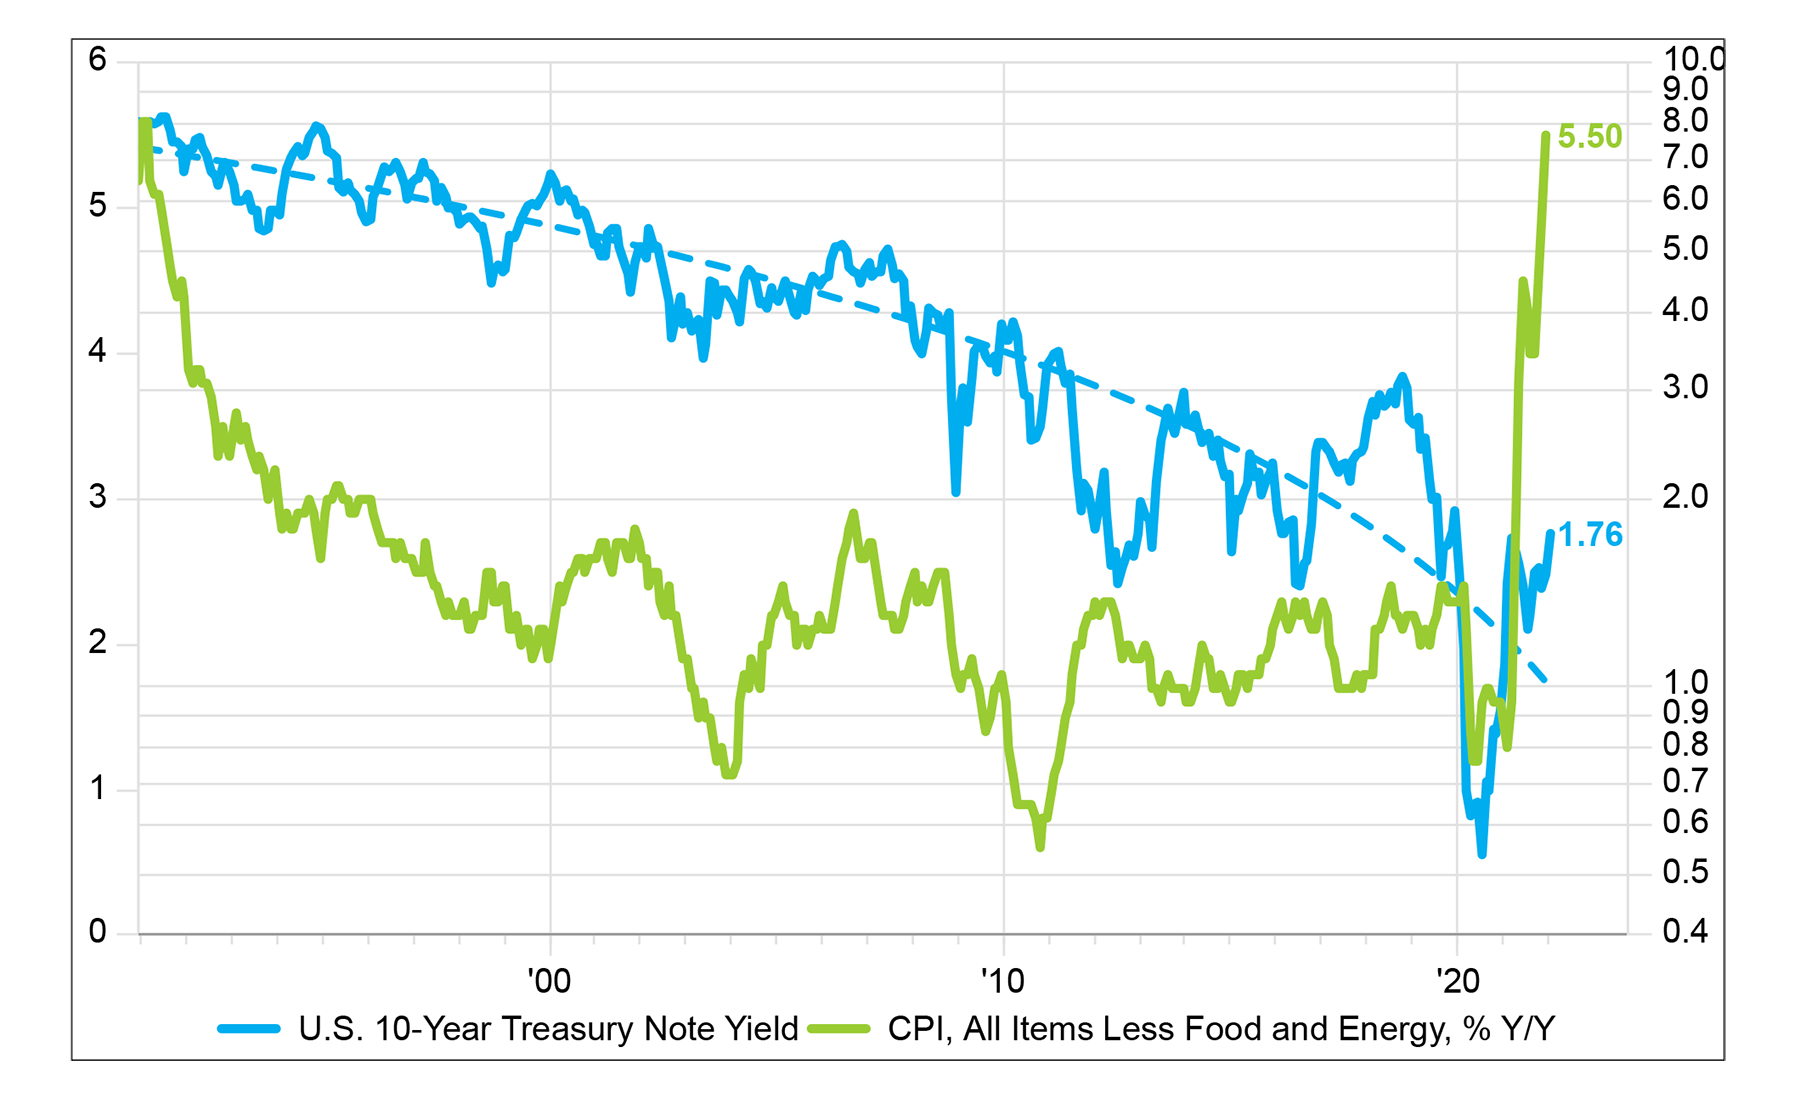
High pent-up demand, created by the pandemic, combined with excess monetary and fiscal stimulus, tight labor markets and supply chain challenges have driven inflation upwards to levels not seen since 1982. Cost pressures on businesses to meet demand have resulted in higher consumer prices as businesses flex pricing power to maintain profit margins. Higher inflation across the board in food, energy, commodities, wages and rents has led to a 7% increase in CPI y/y and a 9.8% y/y rise in PPI. This is unsustainably high and is forcing the Fed’s hand to not only end the quantitative easing taper program sooner than expected, but also to begin a new round of fed funds rate tightening.
The key uncertainties are 1) by how much (and for how long) inflation will remain elevated and 2) by how much (and for how long) will rates rise? The Fed is behind the curve, as its thesis that inflation was transitory was proven largely inaccurate — especially in rents and wages but also by the persistent strength in commodities across the spectrum. Timing of supply chain fixes are an unknown, and we believe they will take longer than expected — until the second half 2022, and more likely, 2023. This will mean elevated inflation that is higher for longer, and that the Fed might have to act more swiftly on raising rates. As a result, there will be an overhang in the market… and this uncertainty has formed market weakness to start the year — the S&P 500 index is down 8% and the Nasdaq Composite index is down 13% as we write. Going forward, we expect the Fed’s interest rate policy will continue to be data-dependent.
Chart 2: GDP % Q/Q Growth2
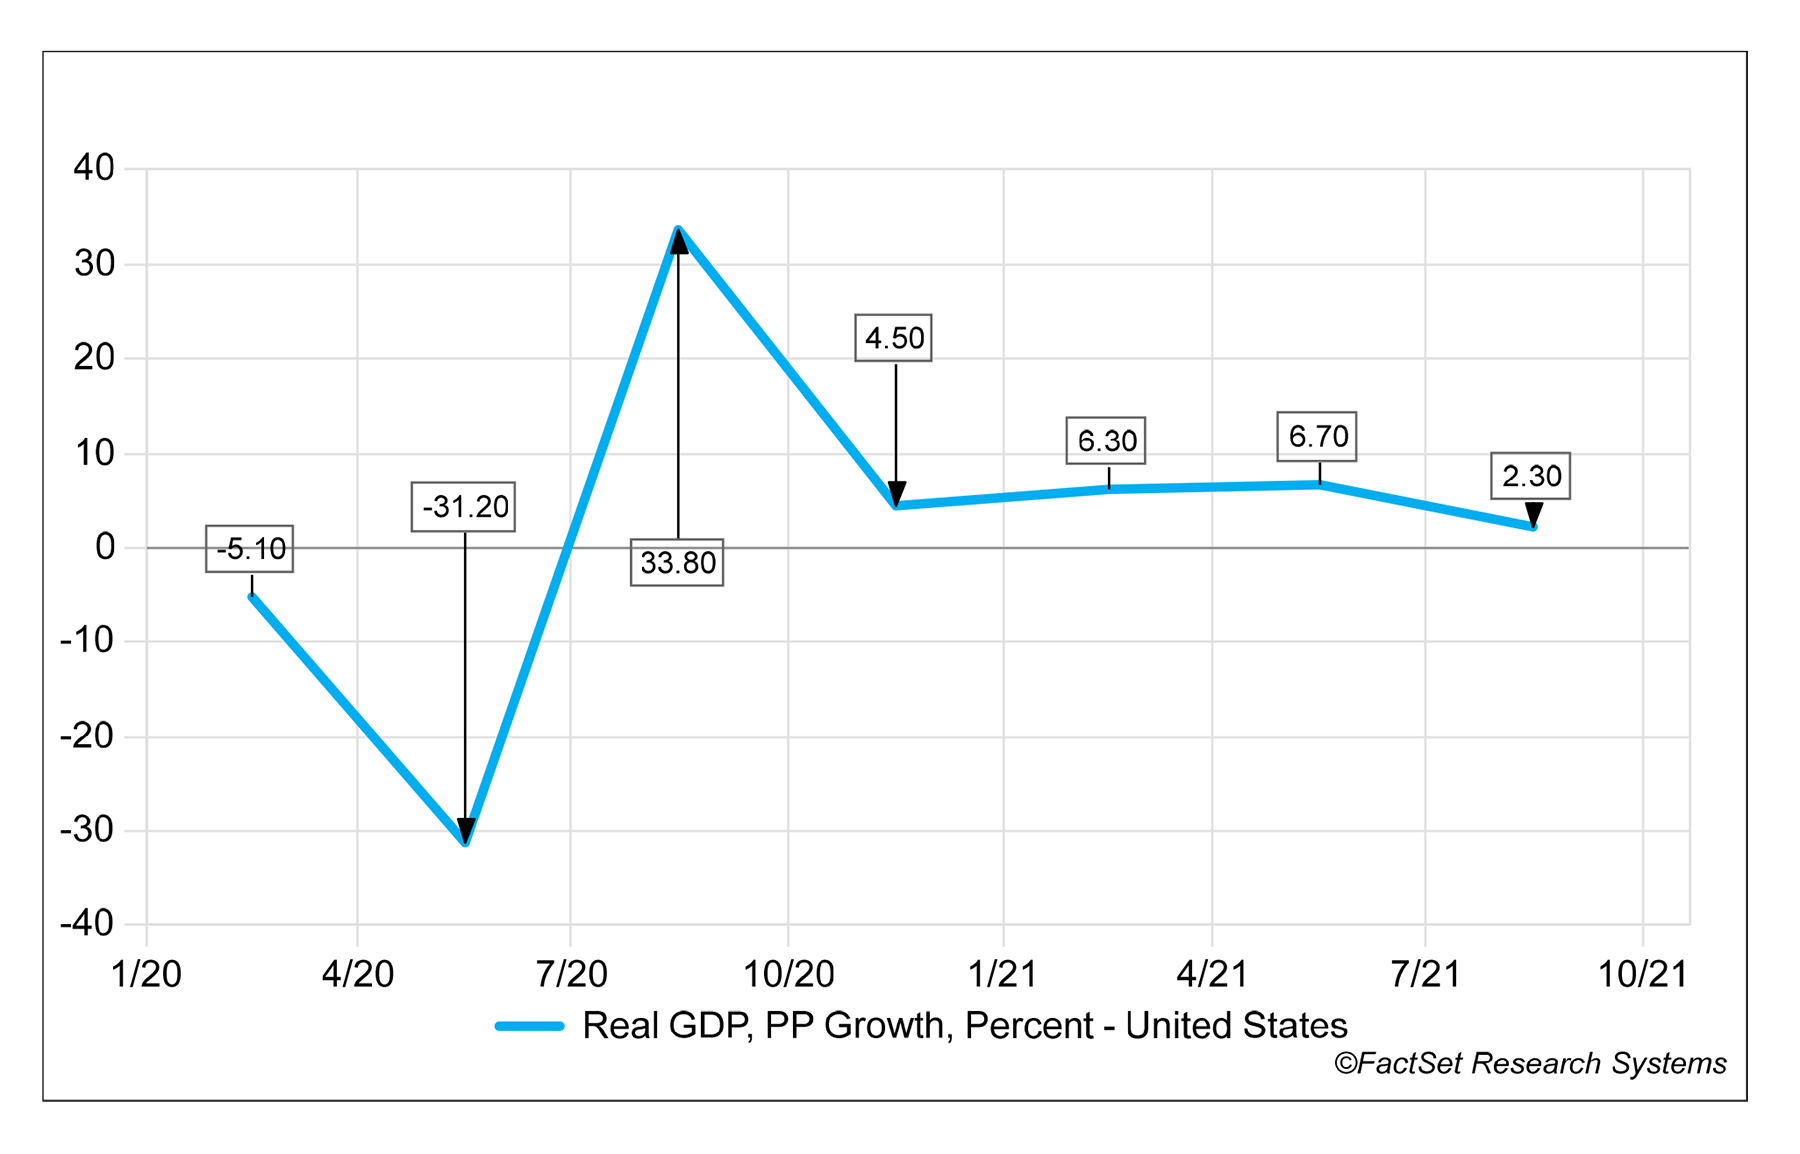
The positive news is that consumer demand remains resilient. Balance sheets are strong, there is $2 trillion in checking accounts (pent-up demand), spending is up 25% above pre-Covid levels, debt service ratios are the best in 50 years, jobs are plentiful and wages are at highs. In addition, we continue to hear from companies describing demand strength creating the need to hire more employees and invest in their supply chains. We believe that post-Omicron, there is enough momentum from the consumer, from the industrial economy and from continued stimulus (the Bipartisan Infrastructure Law and perhaps some form of Build Back Better) to continue driving above-trend growth.
Perspective: Don’t Panic, Stay Diversified
Following the Fed’s May 2013 policy taper announcement, the S&P 500 fell (4.4%) over the next month. For the rest of the year, the market was up 17.4%. The reason stock markets rallied during that period is investors concluded that if the economy was strong enough to withstand the removal of monetary stimulus, then it was healthy enough to continue expanding on its own. The current economy is strong enough to stand on its own and expand, indicated by business activity and demand, without the support of monetary stimulus.
A stock market pullback — greater than (5%) — occurs, on average, about three times per year. A stock market correction — greater than (10%) — occurs, on average, once per year. Investors tend to sell during volatility. In fact, in 2009, as markets bottomed to levels not seen in over a decade, investors were net sellers — even during possibly the best buying opportunity for a generation.3
Market timers who sell during downturns have, on average, suffered. According to J.P. Morgan, historically, six of the ten best days in the market occur within two weeks of the ten worst days. Further, it reports, an investor with $10,000 in the S&P 500 index who stayed fully invested between January 4, 1999, and December 31, 2018, would have about $30,000. An investor who missed 10 of the best days in the market each year would have under $15,000. A very skittish investor who missed 30 of the best days would have less than what they started with — $6,213 to be exact.4 Investors have benefitted most when they stayed the course.
Consequently, during periods of market volatility, we encourage investors to stay diversified and stay invested.
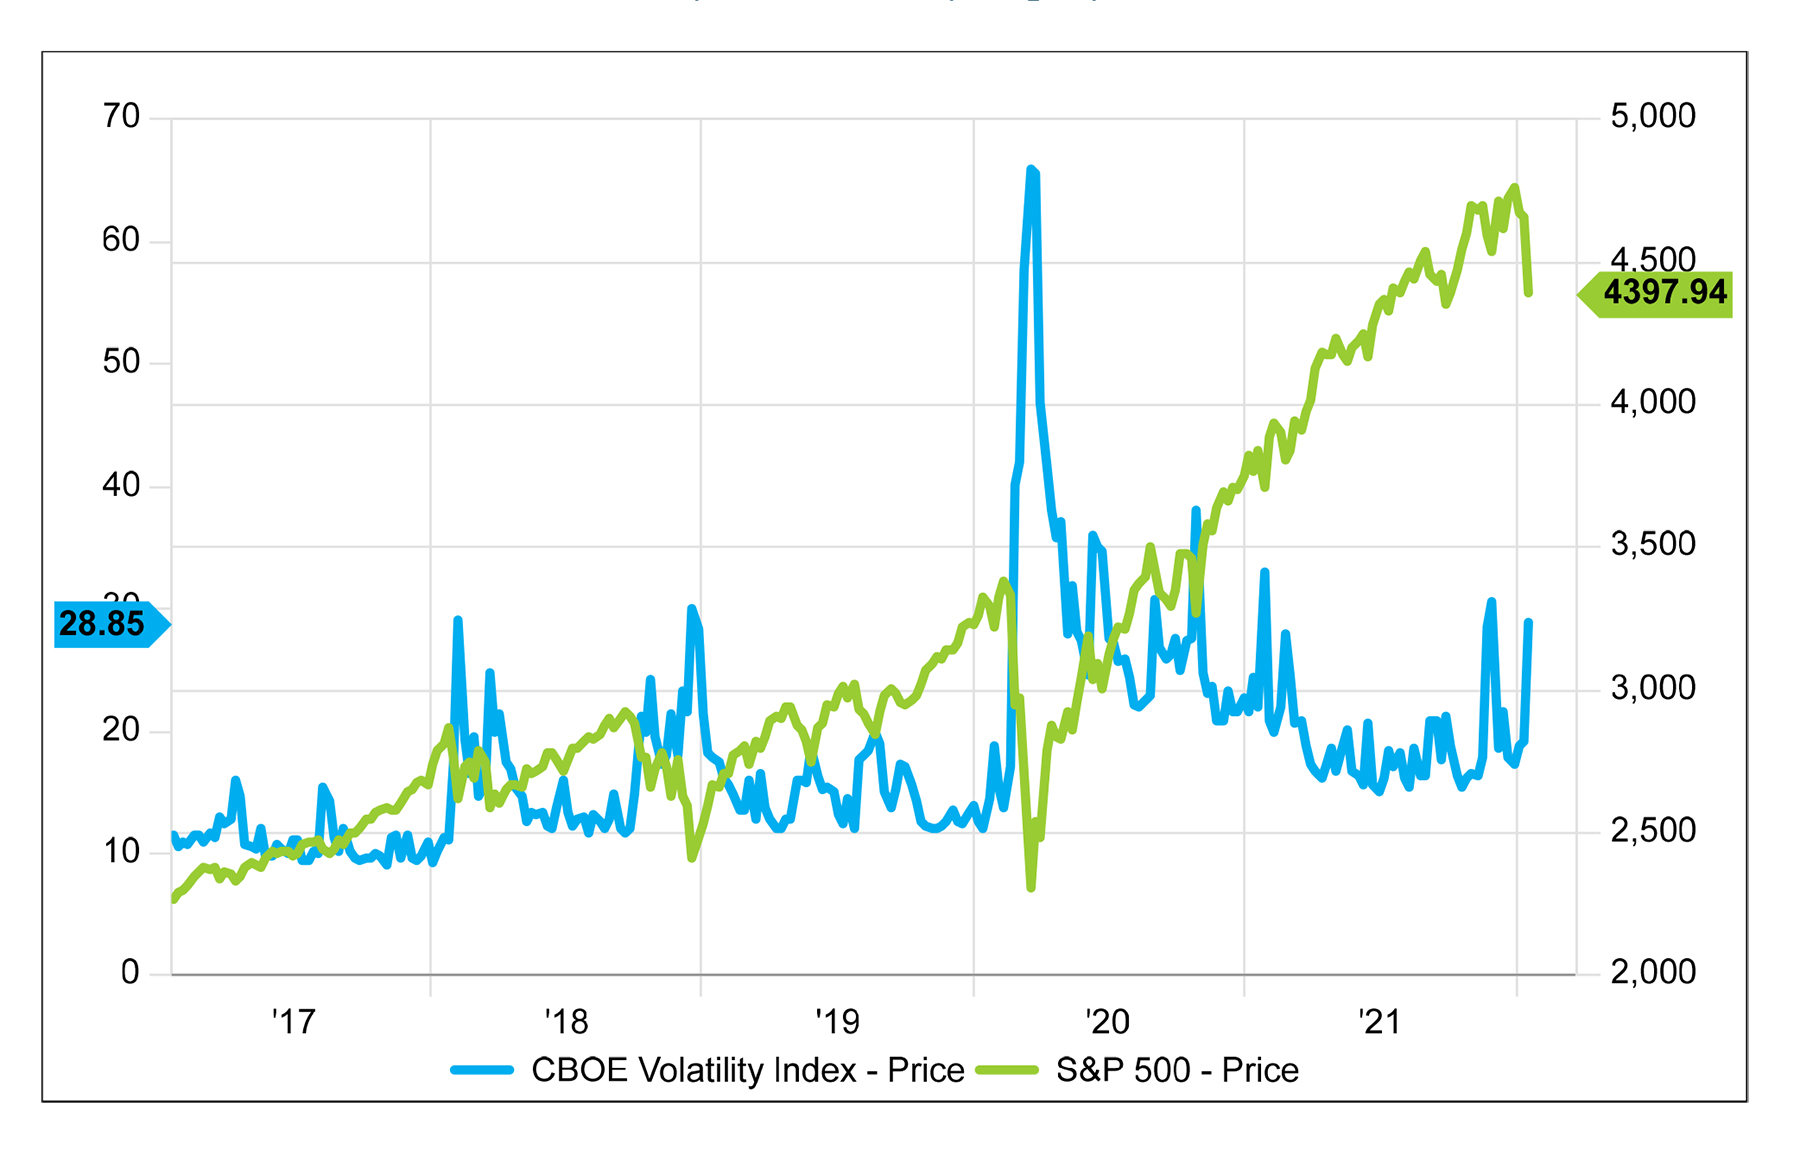
Chart 3: Peaks in Market Volatility Followed by Equity Performance Rebounds5
Forces Behind the Equity Sell-Off
The Volatility Index (VIX) has risen 60% year-to-date, while the ten-year Treasury yield has risen +16% and the S&P 500 index has fallen (8%) over the same period. The Nasdaq Composite index is down (13%) year-to-date, and the Dow Jones Industrial index is down (6%). Energy is the only equity sector with positive performance year-to-date as higher commodity prices fuel the industry. It is worth noting the Russell 1000 Value index (RLV) is leading the Russell 1000 Growth index (RLG) by 900 bps year-todate as people have been selling long duration growth assets and non-earners with expensive valuations in favor of cheaper, value-like sectors. It’s early in the year, and we will watch the data to determine whether to change our tilt towards value, cyclicals and reopen sectors.
Despite the sell-off, it’s important to keep in perspective that the S&P 500 is only (8%) below its all-time high that was reached on January 7, and +30% above its pre-pandemic high. As mentioned, equities are selling off for a couple main reasons — inflation and rates.
We are also witnessing multiple compression — especially among high valuation stocks and non-earners. Higher rates hurt future discounted cash flows.
How We’re Positioning our Portfolios
We continue to believe that 2022 is the year of data dependency. We’re focused on economic trends and data points (e.g., GDP, JOLTs, ISM, consumer data, jobs), inflation (e.g., wages, CPI, PPI), the Fed’s actions (e.g., rate hikes, sentiment) and interest rates.
We are underweight technology as higher rates and inflation are likely to impact valuations relative to earnings. We expect that non-earners see their valuations getting impacted the most by higher rates. In addition, they are overbought and represent a large portion of the S&P 500. If the “earners” within technology correct meaningfully, we’ll look for opportunities. We like to buy quality companies “on sale,” and we may get a chance to upgrade our portfolio as a result.
We are overweight groups that benefit from higher rates, have pricing power (can manage inflationary costs) and benefit from above-trend GDP growth. These include quality financials, industrials, energy and materials. In addition, we are overweight consumer services as the drawn-out — but, in our opinion, inevitable — re-opening continues.
Embrace Higher Rates (Don’t Fight the Fed)
The economy no longer needs emergency monetary policy, and the Fed is beginning to slowly normalize policy. Does higher, more persistent inflation increase the pace of the Fed’s rate hikes? We think that’s unlikely as Fed Chair Jerome Powell has historically maintained dovish policies, as has Fed Governor Lael Brainard. We expect they will watch the data and act accordingly.
Inflation has risen, not just in the United States, but also around the world. The Eurozone CPI is +5% y/y and Germany PPI is +24% y/y (highest on record). And yet, the European Central Bank says no rate hikes until 2023.
Treasury Secretary Janet Yellen believes inflation will come down to the 2% range this year. It may, but higher rental costs and wages, and 11 million job openings, mean that even if supply chains ease, these other items will have longer-term impacts.
1Source: FactSet (chart)
2Source: FactSet (chart)
3Source: Capital Group
4Source: J.P. Morgan
5Source: FactSet (chart)