
Global Energy Trade and Impacts from Russia/Ukraine Conflict
By TRG Advisors on February 23, 2022
Separating the Short and Long-Term Impacts From the Geopolitical Conflict
As the world watches the growing potential for conflict in Ukraine, we are seeing what we believe will be short-term disruptions in the equity and fixed income markets as investors, who typically dislike uncertainty, favor a “risk-off” positioning. In the longer term, we believe the potential conflict will have an impact on energy supply and pricing. Here, we’ll discuss these potential impacts.
Germany Halts Nord Stream 2 Pipeline Certification
The Nord Stream 2 pipeline was completed last year and was designed to provide the flow of natural gas from Russia directly to Europe via Germany. In response to Russia’s aggression towards Ukraine, Germany has halted the certification of the pipeline. German regulators had yet to give the approval, so it has not been in operation, yet all progress towards approval has been halted.
If Nord Stream 2 were to begin moving natural gas into Europe, Ukraine would lose on the fees it generates as a cog in the current transport of natural gas from Russia into Europe. Today, the EU imports around 20% of its gas from Russia, while 80% of Russia’s natural gas sales go to Europe – a significant part of the Russian economy, which represents a quarter of global natural gas trade. Russia also exports roughly 12% of the world’s global oil.
If Nord Stream 2 does ever become operational, it would increase European dependence on Russian gas. The German response is one of many sanctions that European countries and the United States are imposing on Russia. There’s potential for major implications to European energy supply, global energy costs and multiple economies if NATO countries sanction Russian energy exports.
United States Capacity Constraints Limit Ability to Increase Exports to Europe
The majority of crude that is produced domestically is “light sweet” crude. Light sweet crude has low sulfur content, in contrast to the “heavy sour” crude produced by OPEC and Russia that is more expensive to process. The United States imports roughly 61% of its total crude from Canada, which has become more expensive due to the current administration killing the Keystone XL pipeline. The United States imports heavy crude because of the final products it produces (e.g., asphalt, chemicals, rubbers, plastics) and because many of the domestic refineries in the Gulf region were designed to refine heavy sour crude oil.
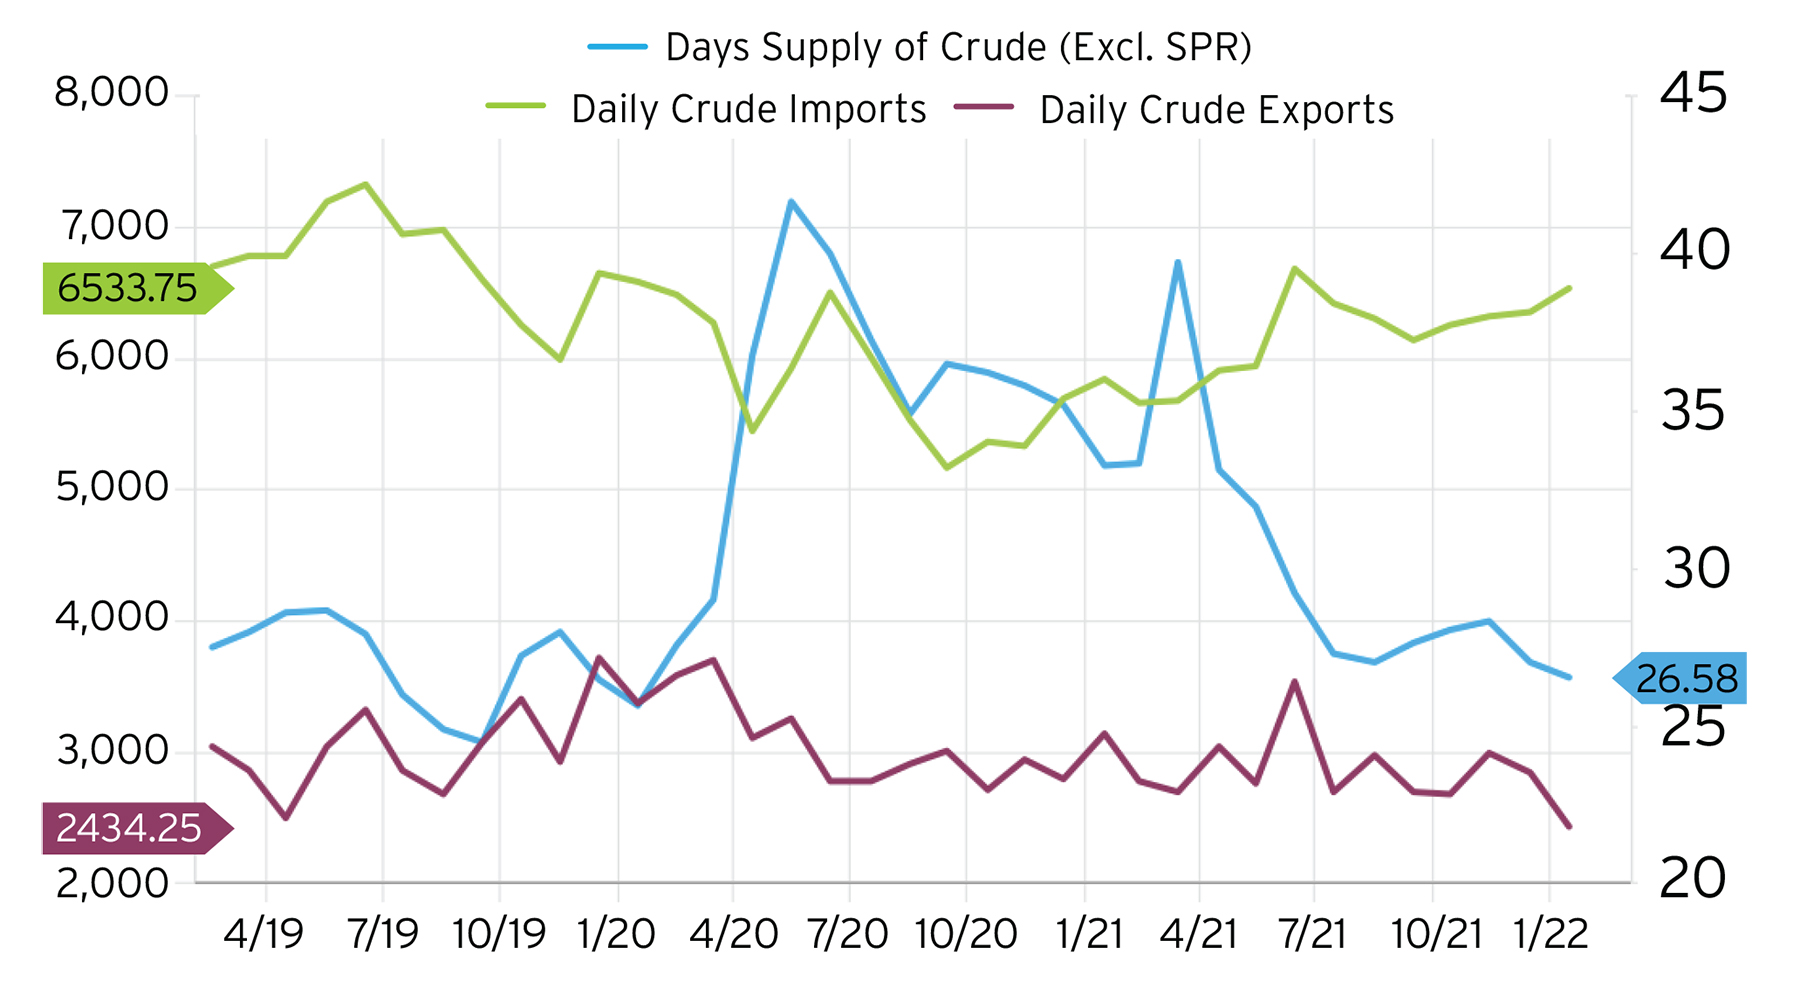
Domestic oil production is 11% below pre-pandemic levels and 2% below where it was at the beginning of this year. In addition to lower domestic production, the U.S. is exporting 45% less crude to the rest of the world and importing 7% less crude compared to pre-pandemic. So, even though net crude imports are 69% higher, lower domestic supply levels continue straining our ability to help supply foreign allies. Lower production is the result of a 23% reduction in active oil rigs vs. pre-pandemic – even as oil rig activity has increased 10% since the beginning of the year.
The oil-rich fields in the Permian Basin in the Southwestern U.S. make up the majority of production growth, yet growth rates are not being impacted as much as what might be expected from the high price of oil. Domestic oil producers say they cannot increase production to pre-pandemic growth levels because of the prospect that these drilling locations would dry-up due to over-production. Rising materials and labor costs, a lack of available financing and the enormous number of new wells required are all headwinds for production growth. Rig activity is expanding, though certain energy companies like Diamondback Energy (FANG) are committed to keeping production flat and returning cash to shareholders.
Chart 1: U.S. Imports and Exports Below Pre-Pandemic Levels1
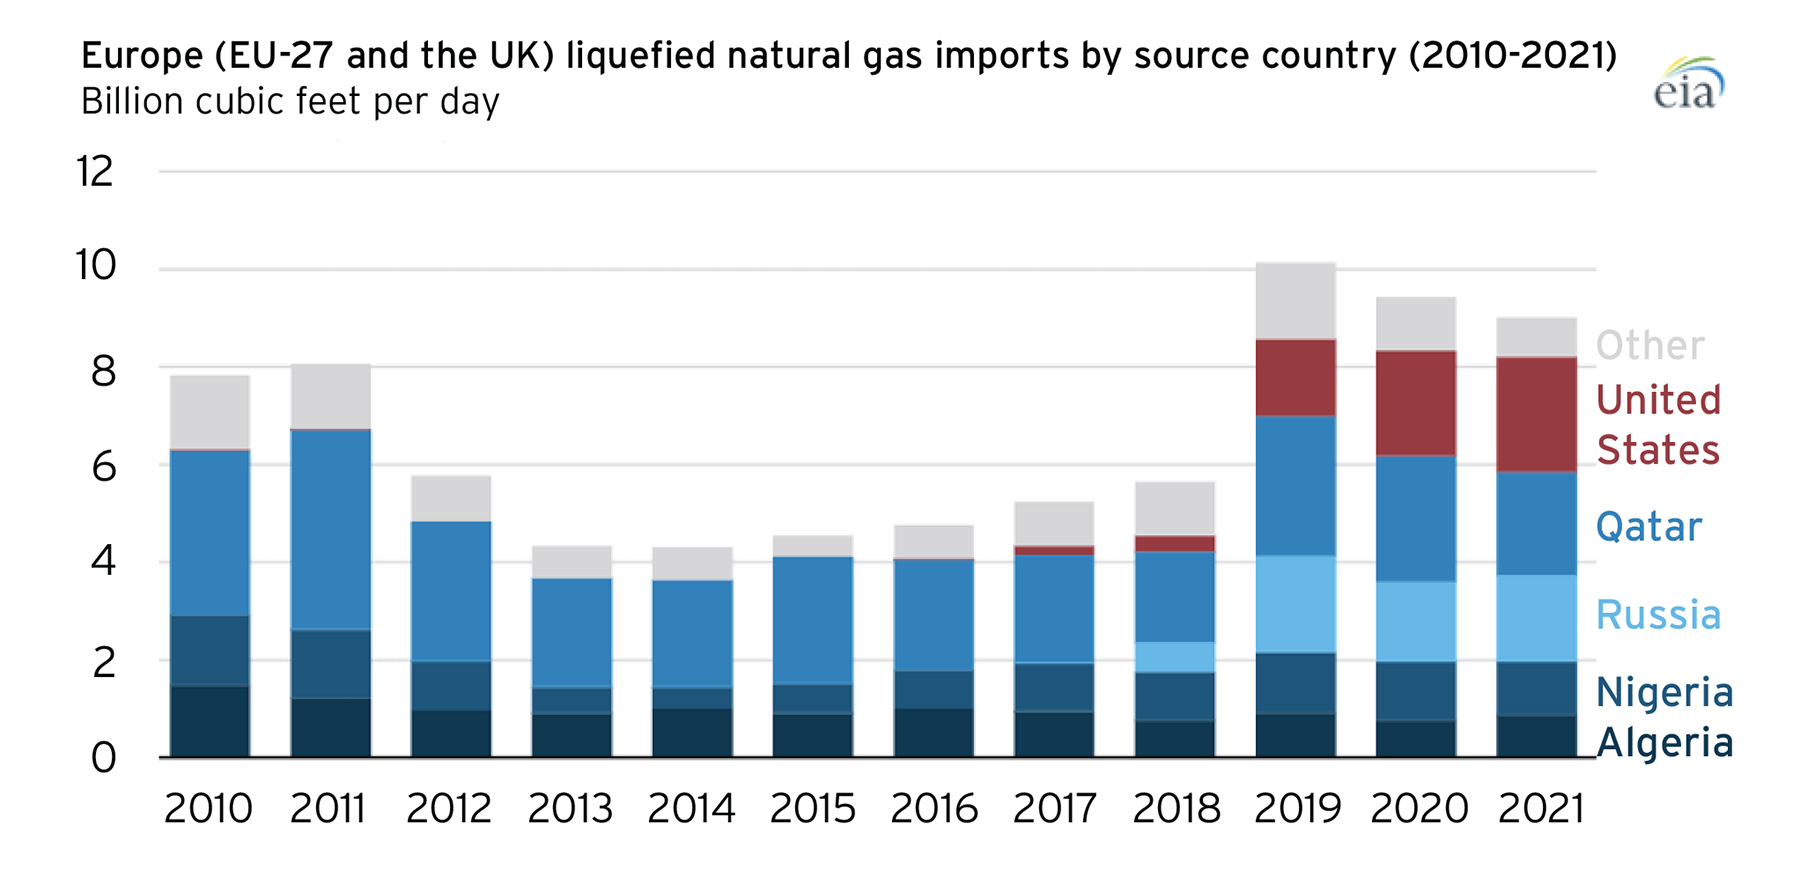
The United States is the global leader in natural gas exports and supplied more than half of Europe’s liquefied natural gas imports in January. Sanctions against Russia’s natural gas exports would greatly impact Russia’s economy, but also increase the strain on European natural gas levels. Europe would increase their reliance on additional imports from countries like the United States, which are already capacity constrained at current levels. With Europe’s reliance on Russia for natural gas and low levels of natural gas storage internationally, a restriction on imports from Russia could have consequences in the form of higher prices and potential regulations.
Chart 2: Europe Natural Gas Imports Rely on U.S., Russia and Qatar2
OPEC Supply Constraints
OPEC has been consistently falling short of its goal to increase daily production by 400,000 barrels per day (bpd) per month. OPEC is producing more than 1 million bpd below its target; only Suadi Arabia and the UAE appear to have enough capacity available for increased production. Capacity restrictions include operational difficulties from under-investment and security breaches due to turmoil within the countries that makes them unstable corporate partners.
United States Outlook and Investments in Energy Companies
As total crude oil and petroleum product stocks remain below pre-pandemic levels and the international economy continues to re-open, we anticipate demand will continue to outpace supply in the current energy cycle. Energy companies are increasing production, but maintaining a focus on capital discipline and returning capital to shareholders through cash dividends and buybacks. Most have also deleveraged in the past year, allowing for further flexibility with their increased free cash flows. The S&P 500 energy sector increased aggregate free cash flow per share by +57% on a two-year stack in 2021. International supply levels also provide a long runway for export demand since the United States will likely be called upon by its allies to support global energy needs.
Increasing rig activity and supply is contributing to higher margin outlooks for refineries that process oil into end-products. Demand for premium products like renewable diesel and biofuels are contributing to higher profits and outlook. Energy service companies that are improving efficiencies and technologies across the energy supply chain also benefit from increasing rig activity. In 2021, Schlumberger (SLB) recorded their highest net and operating margins since 2014.
Energy has underperformed the broader S&P 500 index since 2014. The bull rally in energy lasted from 2004-2014. Supply-led activity growth is expected to drive energy stocks in 2022, followed by demandled growth in 2023 and a long cycle of capacity expansion driven by technology adoption and lower carbon emissions. We have maintained an overweight outlook on energy stocks for the past year as they have executed cost discipline, free cash flow generation and shareholder friendly actions. These companies continue to maintain pricing power in a tight supply environment with growing re-open demand.
Chart 3: Energy Outperformance Pre-Great Recession and Into 20143
